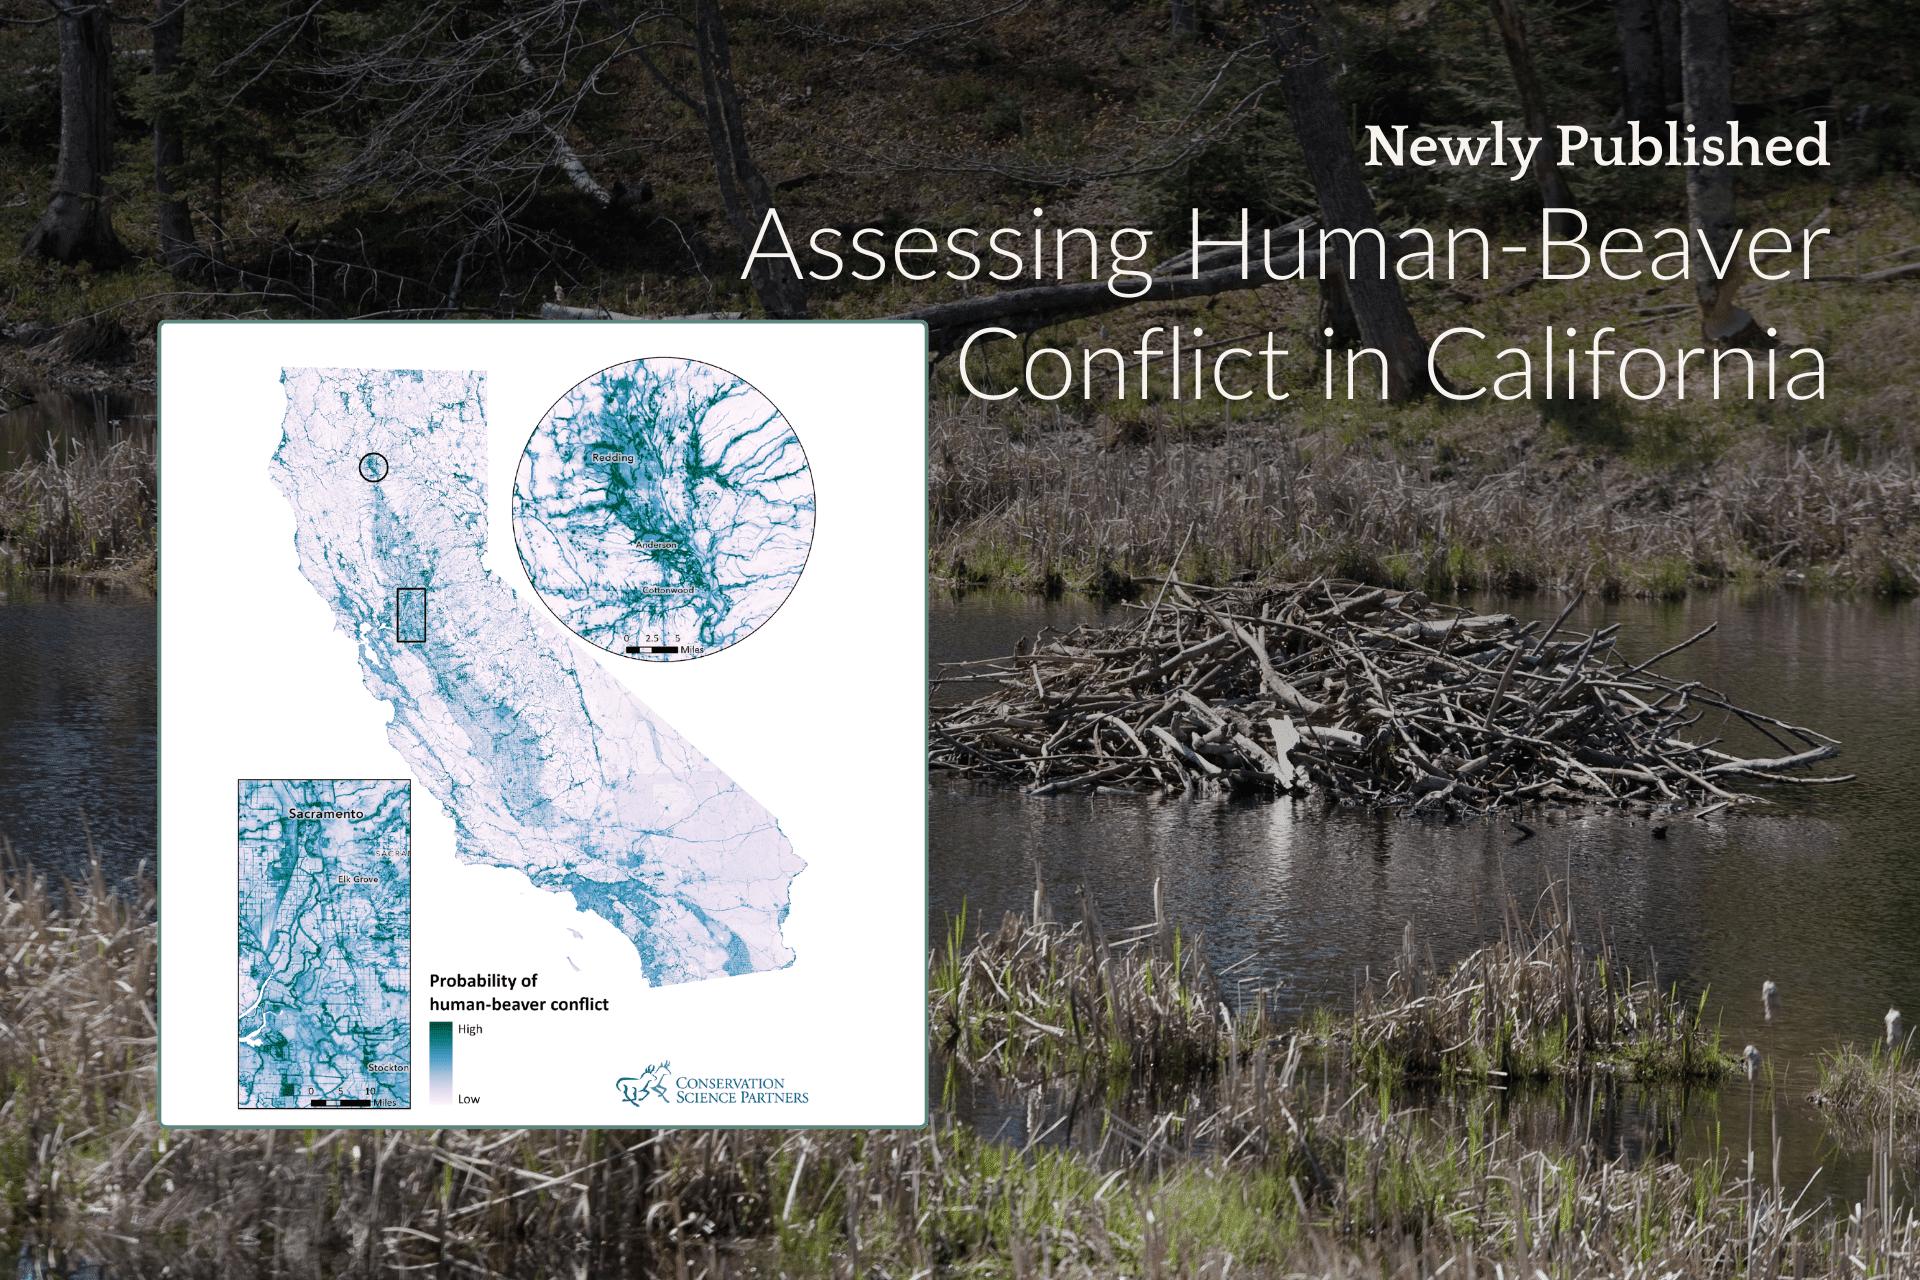
Recently, the WATER Institute team collaborated with Conservation Science Partners to publish California’s first beaver habitat suitability analysis and interactive web mapping model.
As part of our ongoing interest to better understand the nature of beaver conflicts, the findings illuminated in this report offer important considerations to make when determining how to best support beaver coexistence in California, while also producing an accessible public map showing where human-beaver conflict is most likely to emerge.
Click and explore the interactive Human-Beaver Conflict Analysis Model below
The Human-Beaver Conflict Analysis model was created by Conservation Science Partners using California’s Wildlife Incident Reporting dataset, beaver presence observations, and 75 unique variables that influence habitat and conflict. Orange circles represent beaver depredation permit requests and purple circles represent documented locations of beaver.
This analysis looks at reported beaver conflicts from California’s Wildlife Incident Reporting datasets as well as beaver presence observations made by people from 2017-2025.
To start the analysis, Conservation Science Partners (CSP) identified 75 measurable variables that might influence suitable beaver habitat, human-beaver conflict, and the places where these things intersect. The variables include landscape types such as agricultural, developed, and wetland; dominant crops such as almonds, rice, and grapes; population density, roadway types, flood frequency; and more.
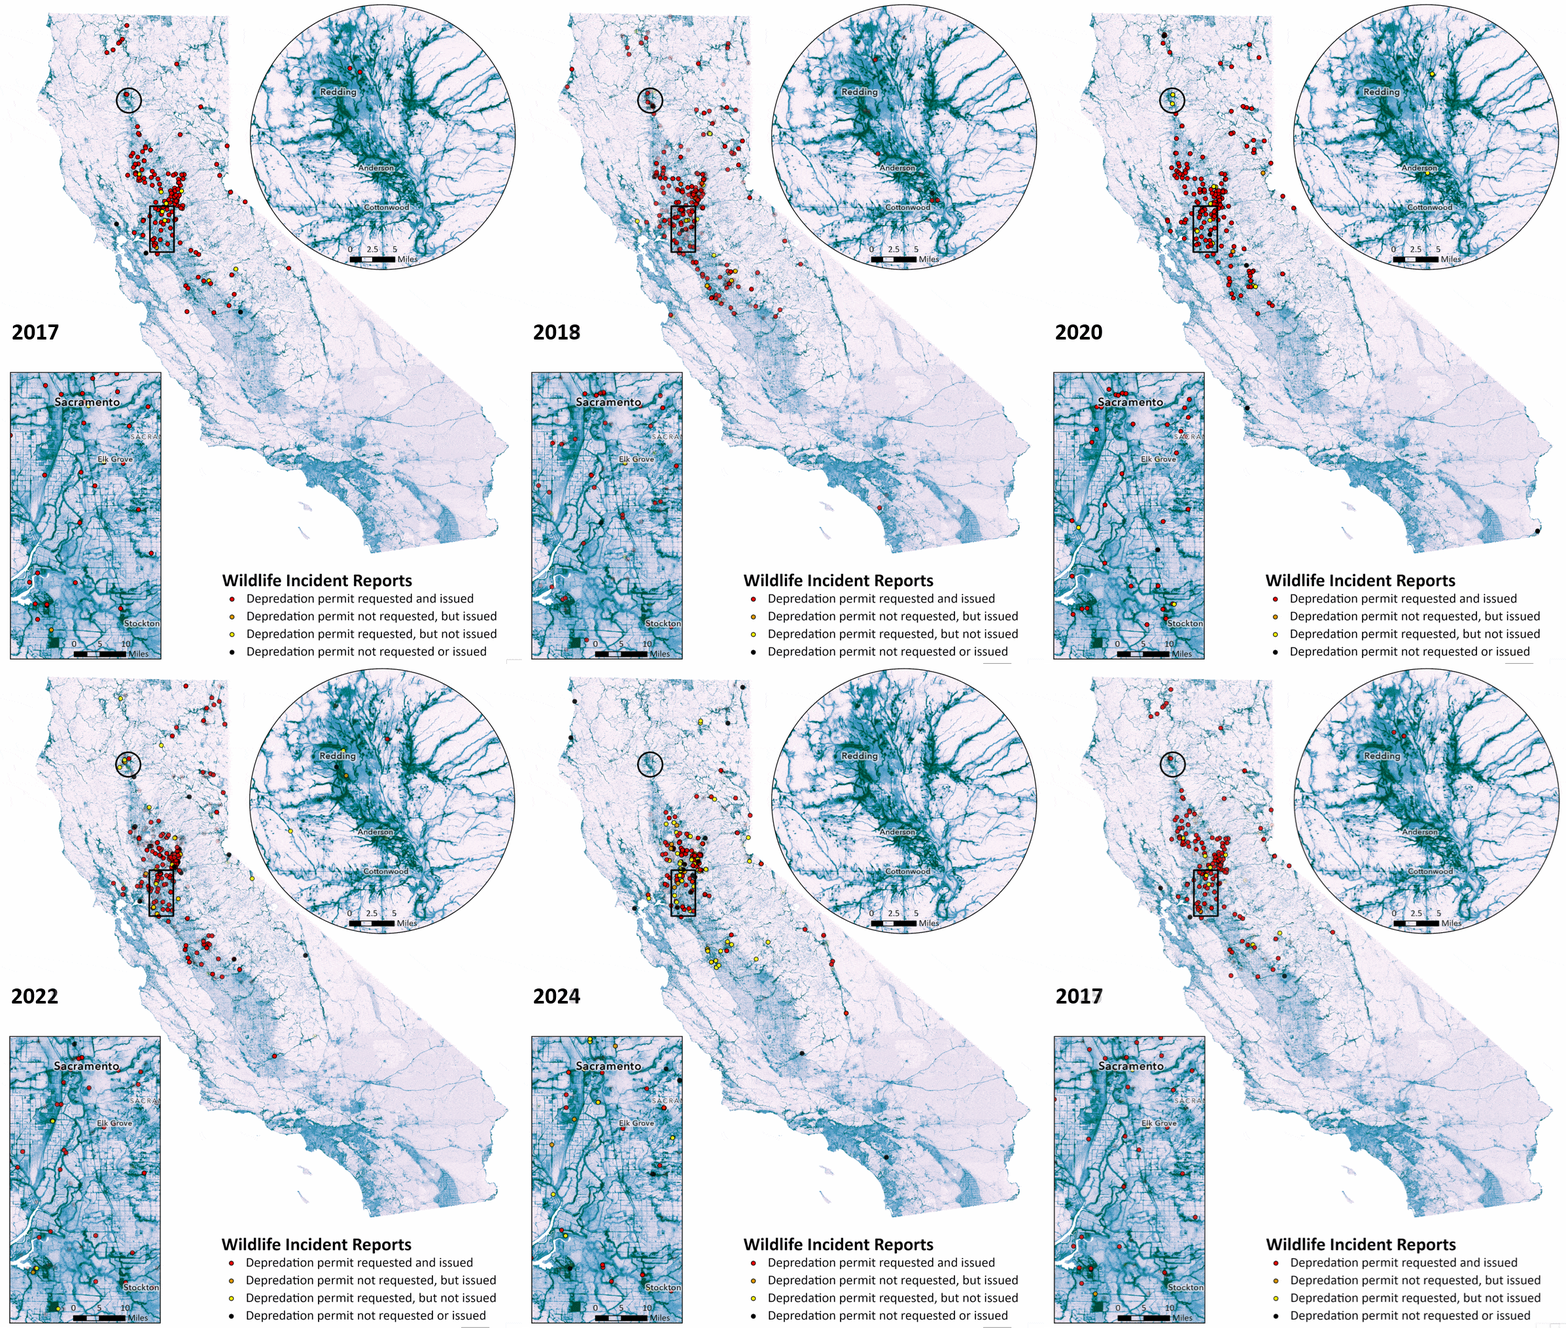
This animated timelapse provides a snapshot of wildlife incident reports from 2017-2025, broken down by depredation permit requests and issuances. These are then overlaid on conflict model outputs. Animation Credit: Conservation Science Partners
After compiling a diversity of data points, they developed a species distribution model for beavers, which was then used in our human-beaver conflict model as a way to predict the likelihood of tension. Both models were then implemented using a machine-learning algorithm called Random Forest, which helps make better predictions about the intersections of habitat suitability and conflict by using “decision trees.”
In this case, by trees we don’t mean precious old oaks chewed and felled at random by overeager beavers; instead, these algorithmic trees randomly sample and process parts of dynamic datasets to create an overall prediction that is more accurate, trustworthy, and resilient.
From there, our team created an interactive web mapping model which allows users to see the analysis results easily. This interactive model overlays the beaver species distribution model and human-beaver conflict model, along with specific sites of observed beaver presence, beaver Wildlife Incidence Reports (WIR), and areas where conflict is most likely to occur.
In the animated GIF above, viewers should note that year-to-year variation in WIR conflict data reflects the variability of conflicts across time and place. This highlights the apparent rarity of repeated conflicts at very specific locations. It’s also notable that in the animated data, a single depredation permit could have been issued for one to tens of beavers. The exact number of beaver actually exterminated is not reported or represented here. Also, CDFW’s depredation policy shifted in late 2023, coinciding with a substantial decrease in requests for depredation permits.
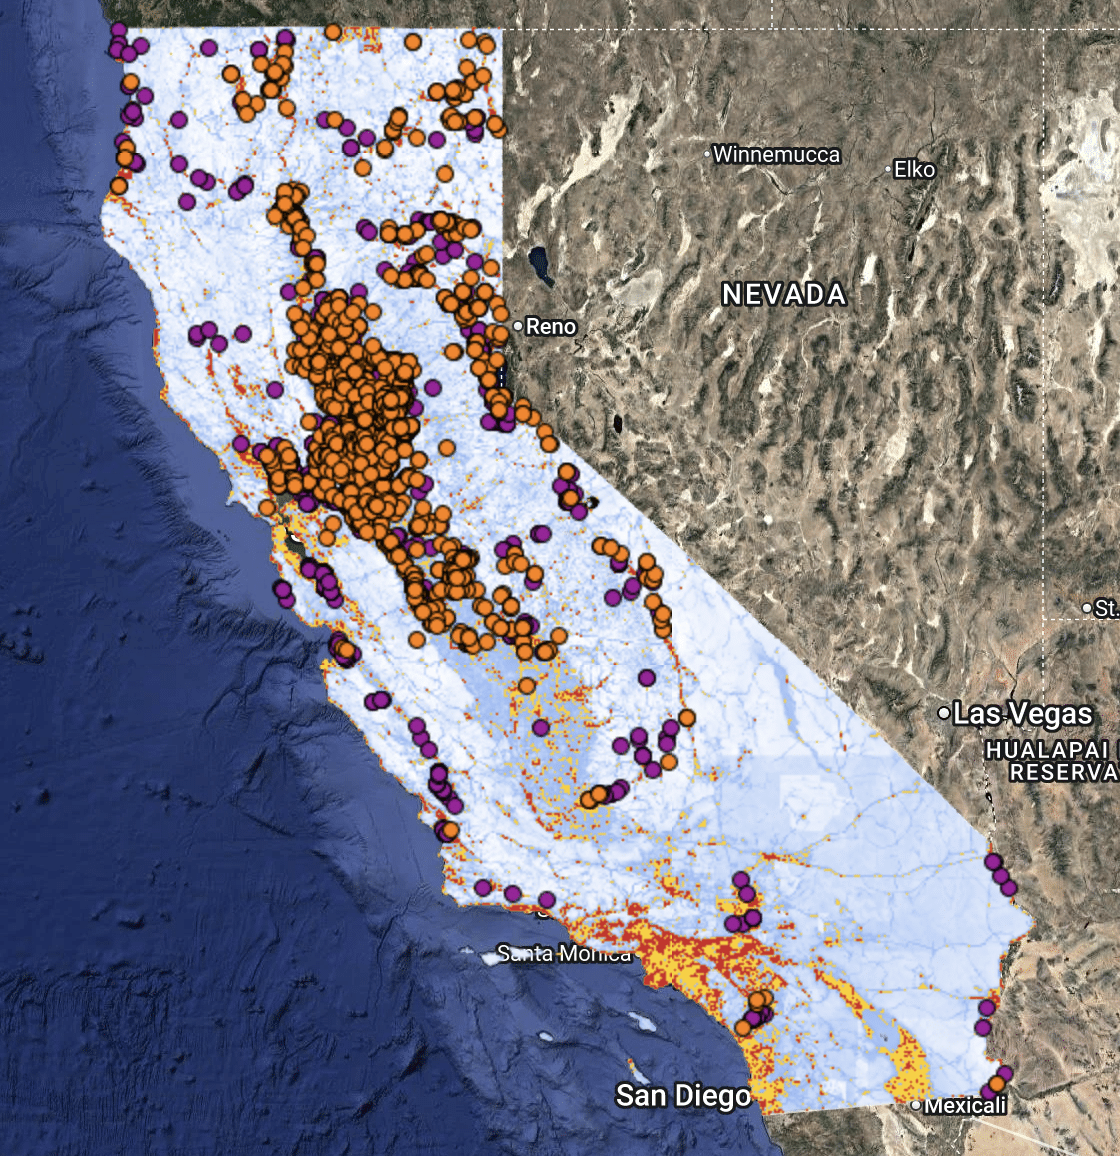
A screenshot from the Human-Beaver Conflict Analysis Model with all layers turned on. Current available layers track: beaver wildlife incident reports, beaver occurrences, areas of conflict probability, the human-beaver conflict model, and species distribution models.
Our analysis confirmed that areas of greatest potential conflict emerge where human development and suitable habitat for beaver coincide. The Central Valley, San Francisco Bay Area, Los Angeles, San Diego, and the region surrounding the Salton Sea have some of the highest concentrations of high-conflict potential.
Studies such as this one offer clarity that can help shape beaver coexistence strategies in the present, while offering insights for how to best advance the practice in California. By highlighting regions where conflict is most likely to occur, we can bring community engagement, training, coexistence professionals, and technical assistance directly to these places, ultimately advancing beaver coexistence forward as a practical and accessible solution for California.
Ready to learn more about beaver conflict in California?
Analyses were conceived and performed by Mae Lacey (CSP), with substantial input and data sharing from Carly Thompson (University of Michigan), Trent Pearce, Aaron Hall (Beaver Institute), and Grey Hayes (OAEC). Valuable feedback was provided by Elissa Olimpi and Brett Dickson.


